This is an interactive map that shows turnout rates in the 2017 General Election, along with the percentage of postal votes in each constituency.
The map is based on administrative data collated and published by the Electoral Commission.
- Overall turnout is the ballot box turnout, including ballot papers returned by postal voters which were included in the count of ballot papers and including votes rejected at the count.
- Postal vote turnout is the number of covering envelopes received by the Returning Officer or at a polling station before the close of poll as a % of the total number of postal ballot papers issued (excluding any undelivered or returned as spoilt, lost, or cancelled).
- In-person turnout is the turnout after removing postal votes from the calculations.
- % postal vote is the number of ballot papers returned by postal voters which were included in the count of ballot papers, as a % of the total number of ballots at count.
Postal vote rates and turnout
Here's a scatter plot showing the postal vote turnout against the overall turnout within the distribution of UK constituencies. There is only a moderate correlation between these two turnout measures.
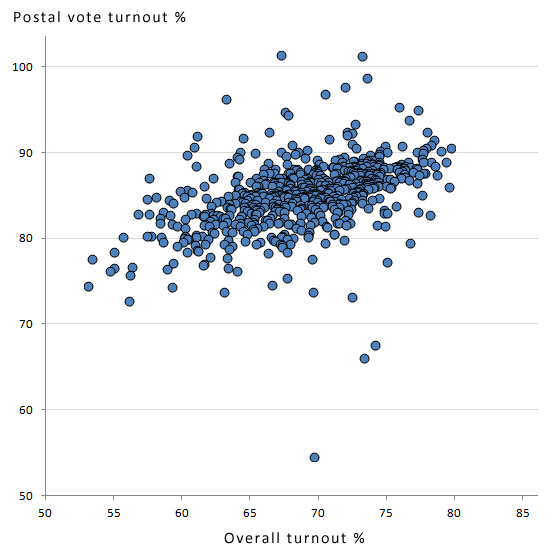
(The Electoral Commission data seems to indicate that two constituencies, Solihill and Meriden, had postal vote turnouts above 100%. I don't know why that is.)
On average across the UK 21.6% of votes were postal votes, and the postal vote turnout was 85.1%. In English constituencies 21.9% of votes were postal votes and the postal vote turnout was 85.3%.
In England there was little difference between the average % of postal votes in constituencies won by the Conservatives (21.8%) and by Labour (22.1%). The postal vote turnout was slightly higher on average in constituencies won by the Conservatives (86.5%) compared to constituencies won by Labour (83.5%).
If you're interested in rates of postal voting in previous elections, the House of Commons Library published a useful briefing note in 2015.
The Peterborough by-election
Over the past few days there has been some loose talk about postal voting in the recent Peterborough by-election, which Labour won by 683 votes over the Brexit Party. (I live in the Peterborough constituency.)
The electoral administrators have said the overall turnout in the by-election was 48.4% and the postal vote turnout was 69.4%.
Based on the levels in 2017, a postal vote turnout of 69.4% is not high. In Peterborough the 2017 postal vote turnout was 83.4% and the overall turnout was 67.0%.
The ratio of postal vote turnout to overall turnout was quite high in the Peterborough by-election, but not off the charts – in 2017 a dozen or so constituencies had ratios that high.
Quite a few Brexit Party supporters on social media seem to have misunderstood the 69.4% postal vote turnout to mean that 69.4% of votes at the count were postal votes. As far as I can tell the electoral administrators have not yet released any information on the number of postal votes.