Update: Round 3 noise maps for England, along with action plans and a consultation outcome, were published by Defra on 2 July 2019.
(Scroll down if you just came for the maps …)
Noise maps and action plans
The Environmental Noise Directive (END) requires EU member states to produce strategic noise maps every five years. These maps chart the level of noise from industry and transport sources in urban areas, and the number of people exposed to it.
The maps are supported by action plans that provide a framework for management of environmental noise and its effects. Too much environmental noise ("noise pollution") can have serious impacts on physical and mental health, and on biodiversity.
Defra produced the first noise maps for England in 2007. These were communicated to the public via a very nice interactive mapping site at noisemapping.defra.gov.uk – now defunct.
Updated maps were produced in 2012, with the "Round 2" action plans for England published in January 2014. In 2015, after some agitation from the open data community, Defra released the 2012 strategic noise maps as GIS datasets.
These GIS datasets include boundaries for urban areas ("agglomerations") where Defra is required to undertake strategic noise mapping, and more detailed mapping of annual average levels of noise from road and rail. Defra also produces statistical estimates of the number of people affected by noise from major roads, rail lines, industrial sources, and airports.
Where are the updated noise maps for England?
Publication of the Round 3 action plans for England, based on noise mapping undertaken in 2017, has been delayed. Defra consulted on draft plans last year with the intention that the final plans would be published by January 2019. Defra later revised that to March 2019.
Round 3 strategic noise maps for other parts of the UK were published last year: Scotland, Wales, and Northern Ireland.
Several GIS datasets from Defra's 2017 strategic noise mapping, including data on road noise but not rail noise, were released on the Spatial Data Catalogue site in April and May 2018. These datasets were available for download under terms of the Open Government Licence, and catalogued on Data.gov.uk. However the release was unpublicised, and the downloads were withdrawn after a couple of months.
According to tweets from the Environment Agency's Data Team: "The Round 3 noise mapping records were put on DGUK with the expectation of an imminent release. However, unforeseen delays have meant that official publication has had to be delayed. The datasets needed to be removed to avoid confusion amongst users that they were available. We hope to have the Round 3 records up and ready for publication again shortly."
Metadata for non-public files on the EEA site suggests that Defra submitted Round 3 strategic noise maps to the EU in December. However the noise datasets currently available on the new Defra Data Services Platform are only the Round 2 versions.
Some reporting data from the Round 3 submissions is available on the EEA site. This data provides estimates of the number of people exposed to environmental noise in urban areas of the EU, including England, and enables us to make basic comparisons between 2012 and 2017. The reporting data is based on submissions up to September 2018 and may be subject to revision.
Noise pollution in the 25 Year Environment Plan
Defra's first progress report on the Government's 25 Year Environment Plan, published last week, makes no mention of noise pollution. However the outcome indicator framework for the Plan includes an indicator on exposure to transport noise (H5).
The indicator will show "the estimated number of people exposed to noise levels (in 5dB bands) from the most significant road, rail and air sources", and Defra notes that the data used for the indicator is "currently derived through strategic noise mapping undertaken at 5-year intervals." This indicator is apparently not available for reporting in 2019.
Anyway I made some maps
In summary, we are still waiting for an authoritative publication of Defra's latest strategic noise mapping and action plans for England. However the 2017 information available so far seems to suggest that in most urban areas there has been an increase in the number of people exposed to significant levels of noise from transport sources.
As an illustration, the map below compares the 2012 and 2017 mapping for an area around the M25 Junction 17 at Mill End near St Albans. (Move the slider to compare the overlaid maps.)
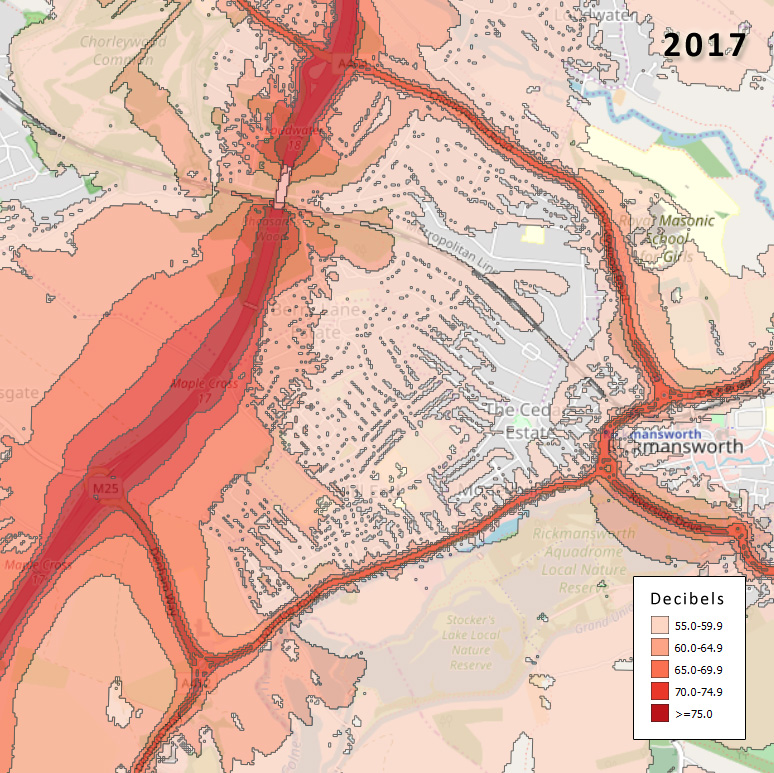
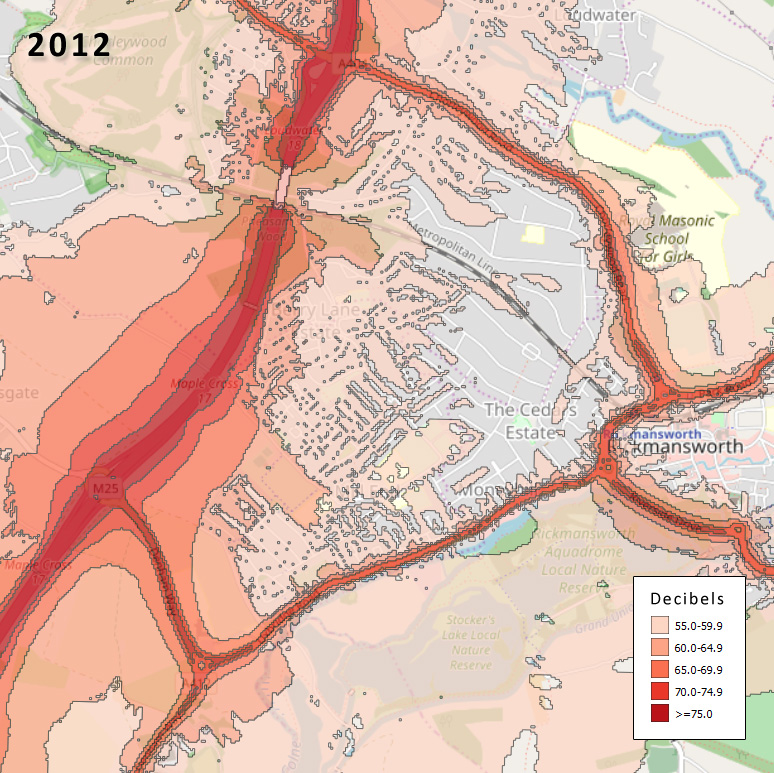
Attribution: noise data © Defra 2018 and base map © OpenStreetMap contributors.
This map is based on the "Lden" measure of 24 hour annual average noise levels with separate weightings for the evening and night periods. Other measures are available for night time annual average noise levels ("Lnight") and noise levels for the 16-hour period between 0700 and 2300 ("LAeq,16h").
The reporting data on the EEA site is a less granular source of information. However it indicates that:
- total kilometres of major roads in England with more than 3,000,000 traffic movements a year increased from 25,475 to 38,118 between 2012 and 2017 (50%);
- total kilometres of rail with more than 30,000 trains a year increased from 5,012 to 5,472 (9%);
- the number of people exposed to annual average road noise levels in excess of 50 decibels (based on the Lden measure) increased in 59 of 65 urban areas; and
- Slough is the only urban area in England were more than half the population is exposed to annual average road noise levels in excess of 50 decibels (based on the Lden measure).
The interactive map below shows the 65 urban areas or "agglomerations" in England covered by Defra's strategic noise mapping.