Post: 10 May 2017
Last month was the seventh anniversary of the launch of Ordnance Survey’s popular suite of open data products. OS OpenData includes mapping from national scale down to street level, administrative boundaries, a geocoded postcode dataset, and other useful digital infrastructure for Great Britain.
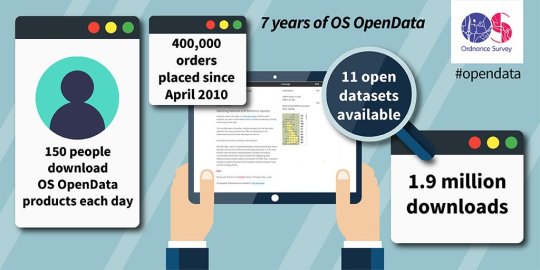
OS published a blog post and tweeted an infographic (shown below) with some basic statistics for downloads and orders placed via the OS OpenData Supply page.
I recently submitted a Freedom of Information request asking for a breakdown of those statistics, and today I received a response from Ordnance Survey.
OS has provided a breakdown of OS OpenData orders and items in each financial year from 2010-11 to 2016-17, with separate figures for downloads and items supplied on DVD, and a further breakdown of items by market sector.
Orders and Items
First it’s necessary to understand the difference between Orders and Items. As OS explains:
“an Order means the order which is generated when a user visits the OS OpenData portal and downloads (or orders DVDs of) one or more OS OpenData products. An Order can therefore include more than one product, but all must be downloaded/ordered in the same session on the portal.”
“an Item is a more granular term than Order, meaning the download/DVD order of a particular product for a particular area (e.g. if a user downloads 5 different tiles of OS Open Map – Local, that counts as 5 Items).”
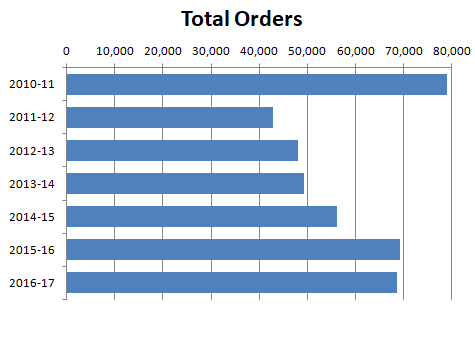
Below is a chart showing the total number of Orders generated in each year:
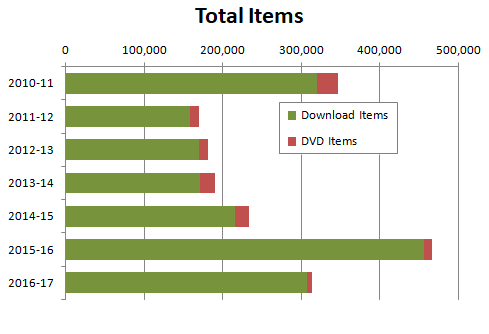
And below is a chart showing the total number of Items, split by download items and DVD items:
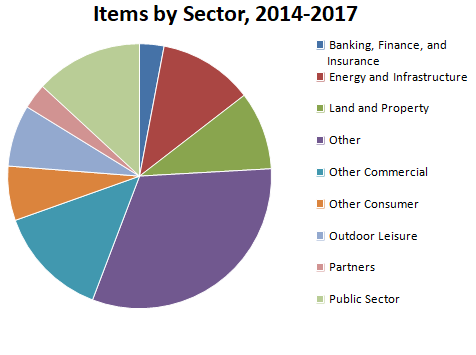
Market sectors
OS’s ordering service requires requesters to specify their market sector. Below is a chart of Items generated for users identified with each sector, in 2014-2017:
“Personal” use
The ordering service also requires requesters to enter a company name or to specify “Personal” if they plan to use the data for personal reasons. OS says that for the period from 1 May 2016 to 31 March 2017 32.7% of Orders and 37.2% of Items were specified as “personal”.
However the 40% figure in OS’s blog post and infographic was based on a different metric, the total number of Products:
“A Product here means a single user (identified by email address) downloading (or ordering by DVD) a single product on a single day, i.e. where a user downloads two tiles of, e.g. OS VectorMap District, on the same day, this counts as a single Product.”
For the period from 1 May 2016 to 31 March 2017 there were 86,507
orders of Products, and in 31,319 the requester identified their use as “personal”. That’s a percentage of 36.2%, which
OS rounded up to 40%.
Commentary
OS OpenData occupies a significant position in the landscape of UK open data policy and is important infrastructure for building open services and other open data products. Measuring demand for open data is inherently difficult, so it’s useful to have more detailed statistics on throughput from OS’s ordering service.
However it’s important not to overstate the significance of downloads as a metric for open data demand or re-use. Open data by definition can be passed around and combined with other data, so OS’s order service is not the only source for OS OpenData. For example many geographic datasets available from the ONS Geography portal contain Ordnance Survey data, and MySociety maintains a cache of older versions of OS OpenData products.
We also don’t know much about what happens after requesters acquire OS OpenData via the ordering service. Some will have only a casual interest or may decide the data isn’t what they need. On the other hand some will save the data locally and use it for multiple projects. Value-added resellers and large organisations in particular are likely to download each OS OpenData release once, store it on an internal server, and redistribute it to their users and customers as necessary.
The Order and Item figures have to be viewed independently because the relationship between them depends on the products requested. Some of the OS OpenData products are ordered as a complete dataset and others may be ordered in sections, e.g. tiles. The mix of products within the OS OpenData suite has also changed since the launch in 2010. So we don’t know, for example, why the Items total was unusually high in 2015-16. It may be possible to get a more complete picture by requesting additional statistics broken down by product (or for specific OS OpenData products).
Information on “personal” use of OS OpenData is limited. OS says it doesn’t hold that data prior to 1 May 2016, so we don’t know if the 40% figure is representative. We also don’t know whether requesters have a consistent understanding of what personal use means. Whether use is personal has no effect on the requester’s rights under the OS OpenData licence, so requesters have little incentive to follow a particular definition or to provide true information about how they plan to use the data. Individual requesters may also use the data for more than one purpose. Sometimes it’s difficult to make distinctions between use of data for hobbies, activism, professional development and business; and one of the virtues of open data is that those distinctions are often unnecessary.