Update: 29 October 2017
I’ve now released the data used in this post as an open data product.
Post: 13 December 2016
The Valuation Office Agency’s annual release of Council Tax statistics is one of the few open public sources of small area data on the age of housing stock in the UK.
The VOA statistics provide estimated property counts in twelve build periods ranging from pre-1990 to early 2016, for every Lower Super Output Area in England and Wales as well as higher geographies such as MSOAs and local authority districts.
I’ve been working with this data recently: some of my analytic outputs have gone into a commercial data product and there’s a free postcode lookup here:
http://www.datadaptive.com/aphs/
LSOAs are everywhere
LSOAs are small geographic areas defined for the purposes of the 2011 Census. There are more than 34,500 LSOAs, with an average of 725 domestic properties each, so the VOA statistics are quite granular.
Government publishes shedloads of other statistics and open datasets for LSOAs; the Indices of Multiple Deprivation are a significant example. There is considerable potential in finding correlations between the age characteristics of housing stock and other geoeconomic measures. In this post I want to cover some ways we can compare age distributions of housing stock in different LSOAs and against national and local authority baselines.
The data looks like this
This is an example of VOA’s build period data for a LSOA:
| Build Period | Properties |
| Pre-1900 | 60 |
| 1900-1918 | 70 |
| 1919-1929 | 30 |
| 1930-1939 | 70 |
| 1945-1954 | 20 |
| 1955-1964 | 10 |
| 1965-1972 | 70 |
| 1973-1982 | 130 |
| 1983-1992 | 150 |
| 1993-1999 | 30 |
| 2000-2009 | 20 |
| 2010-2016 | 110 |
| Unknown | 10 |
| Total | 790 |
VOA has rounded all property counts to the nearest 10 to reflect inherent uncertainty and variability in the data collection process. Counts below 5 are suppressed. There are no records of dwellings having been built between 1939 and 1945 (there was a war on) and the build period is unknown for about 1.3% of properties overall.
The dataset is a frequency table produced from VOA’s records on individual properties. VOA has defined the class intervals (i.e. the build periods) and they have a natural order. These features limit the range of statistical tests that can be applied to the data. But there are some things we can do to find patterns in the data.
The mode
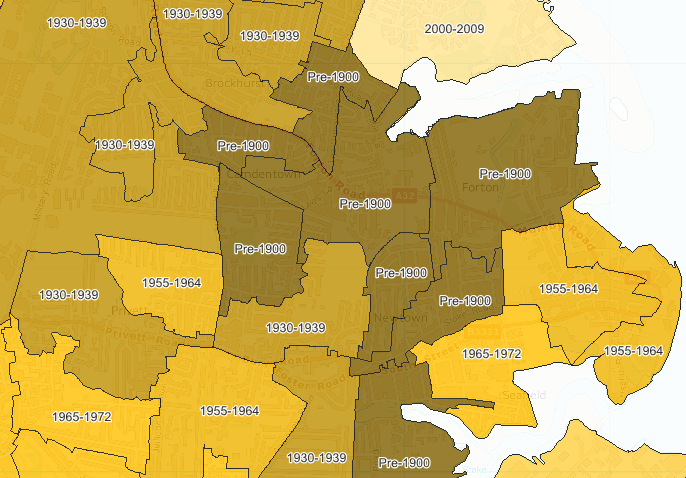
The modal build period is a good starting point. The ‘mode’ is simply the build period with the most properties. This map shows modal build periods in Gosport:
You can explore modal build periods further in an interactive map produced by Oliver O'Brien of UCL using data from last year’s VOA release.
Some LSOAs (nearly 4% of the total) have more than one modal build period. As O'Brien observes in his blog post the mode is not necessarily representative of housing in the area. The modal build period accounts on average for about 44% of the total properties in a LSOA but there is wide variation. Often the mode is the high point of a building trend that includes adjacent periods, but not always.
The mode is useful for profiling the age of housing stock but has to be modified by its relationship to the total number of properties in the LSOA.
The median
We can also calculate a median build period. If we list all the individual properties by date of construction the median build period contains those half way down the list. The median tells us something about the whole distribution within the LSOA, rather than just one significant build period.
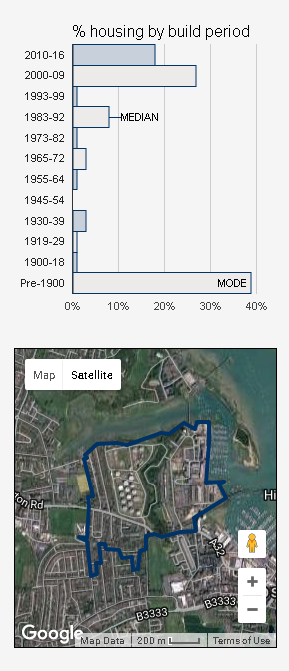
Here’s the same area of Gosport mapped by median build period:
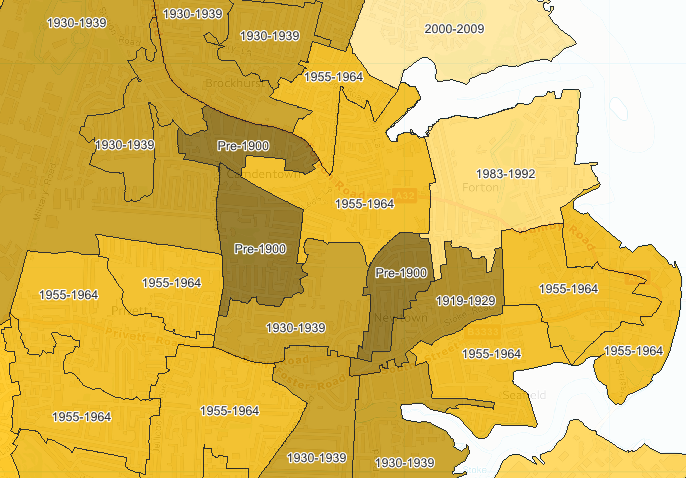
We can intuit from comparison of these maps that the build period distribution in LSOA E01022811 has been skewed by recent development of the waterfront area. This is confirmed in the data:
Like the mode the median cannot automatically be taken as a “characteristic” age of housing stock in an area. The median is the same as the mode (or the same as a mode) in only 61% of LSOAs. As we might logically expect the median and the mode are more likely to coincide in urban areas than in the countryside, where LSOA are geographically larger and may contain several villages rather than a discrete area of housing. But even in urban areas there will be cases where, as in the above example, looking at the mode and median together can tell us more about the shape of the age distribution than either measure will by itself.
Using the mode and median together
One immediate application: when there is more than one mode, we can use proximity to the median to identify a “preferred” modal build period. In the following example there are two modes, 1930-1939 and 1965-1972, but by taking reference from the median we can identify 1930-1939 as more representative of the distribution.
E01000812 Bromley 028D
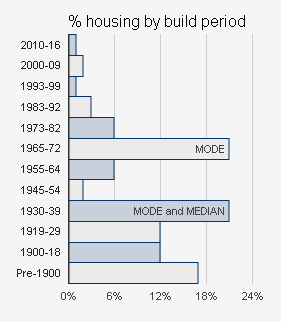
In principle the median build period need not be a mode, so I was somewhat surprised to find that the median is a mode in every LSOA were there is more than one modal build period. This means the median can be used with confidence to identify a preferred modal build period.
Baselines
House building is not random, of course; rates are influenced by economic trends and policy at national and local level. In statistical terms we cannot expect the age of housing stock to follow a normal distribution. The position of the median build period tells us whether the housing stock in a LSOA is generally “older” or “newer”. But older or newer than what?
The median build period for England and Wales (and for each of the two countries) is 1955-1964. But at the local authority level median build periods range widely: from pre-1900 in two London boroughs (Kensington and Chelsea and Hammersmith and Fulham) to 1983-1992 in Milton Keynes.
We can use national and local authority medians as baselines for measuring the extent to which individual LSOAs skew newer or older, in both national and local contexts.
London
Following are maps of modal and median build periods for local authority areas in London (click to embiggen):
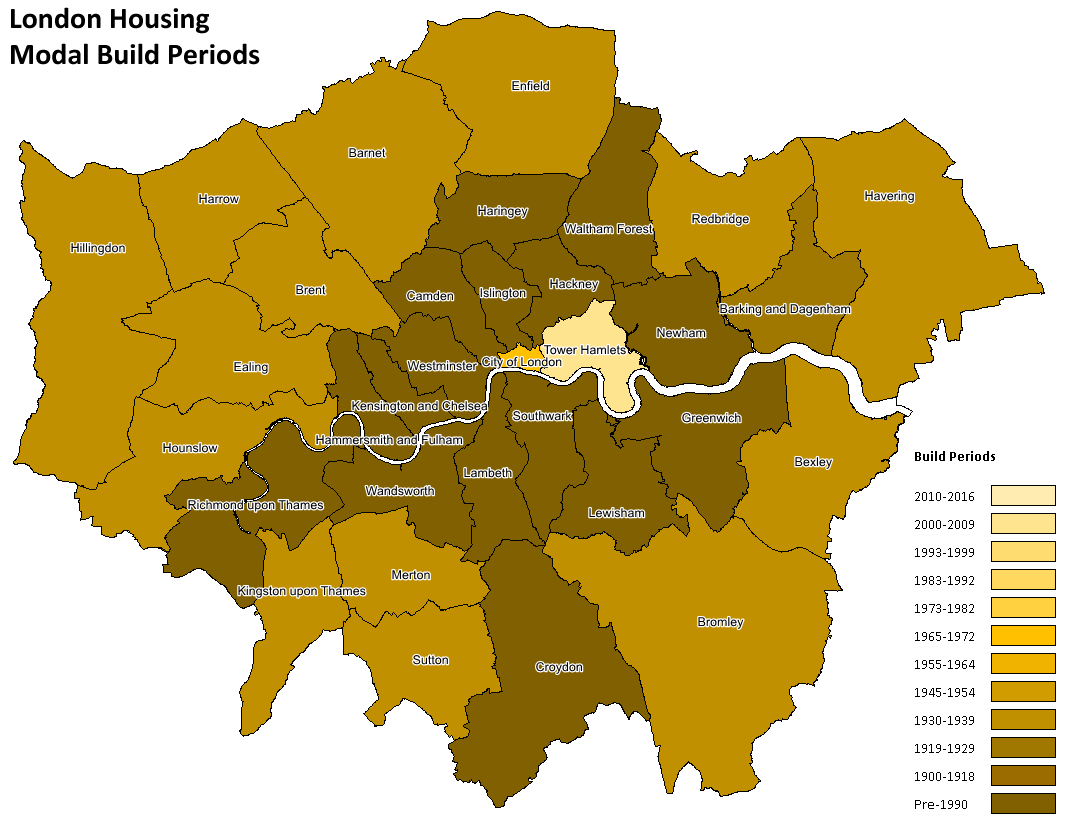
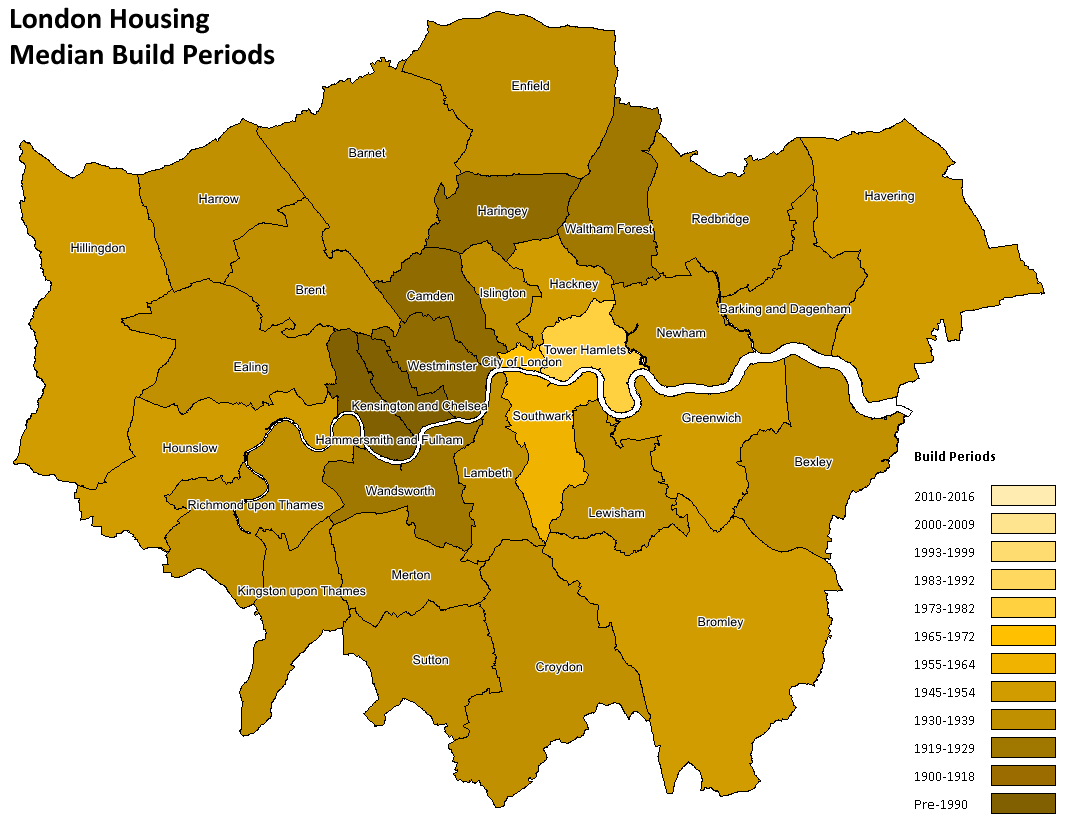
The particular characteristics of Tower Hamlets and the City jump out on both maps. However by comparing the maps we can also see that while the modal build period is resolutely pre-1900 across the inner London boroughs, the median build period suggests their housing stock has developed over a range of different timescales.
LSOAs vs baselines
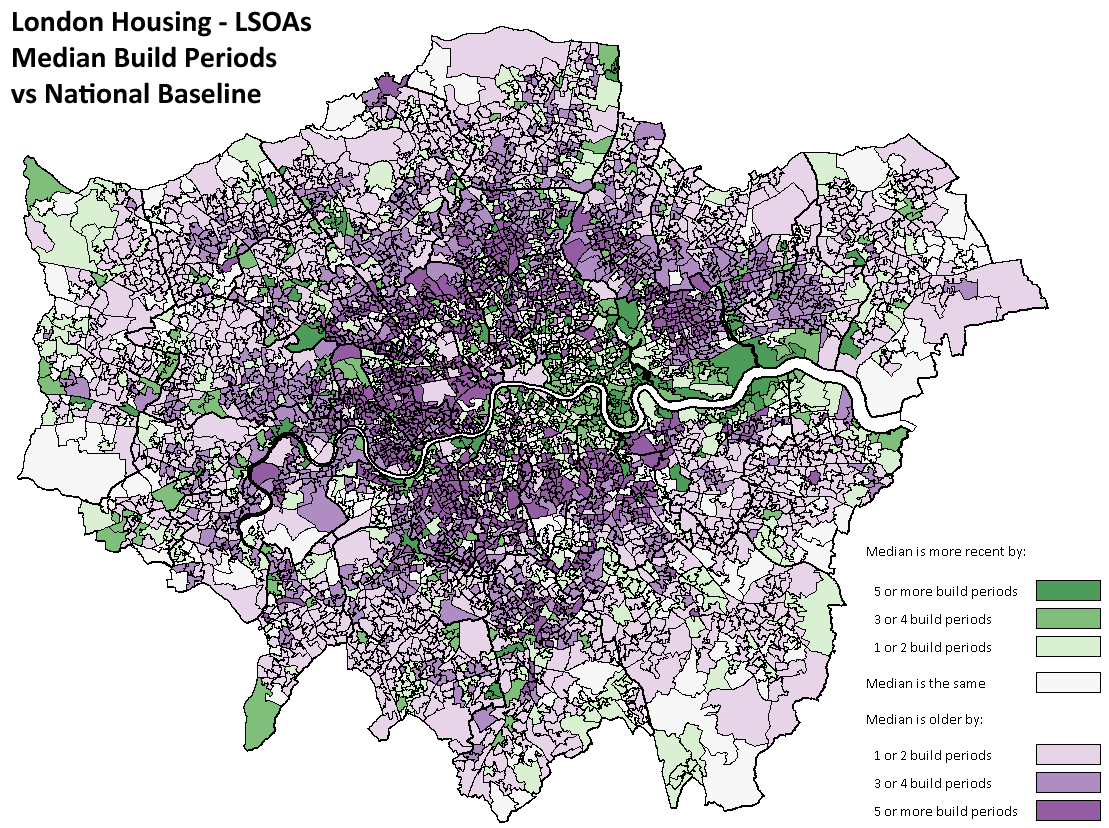
We can make this visualisation more interesting by taking the national and local authority medians as baselines and mapping the difference between those and the LSOA medians. Below are the LSOA median build periods for London mapped against the national median, 1955-1964. Purpler areas are older relative to the baseline, and greener areas are newer.
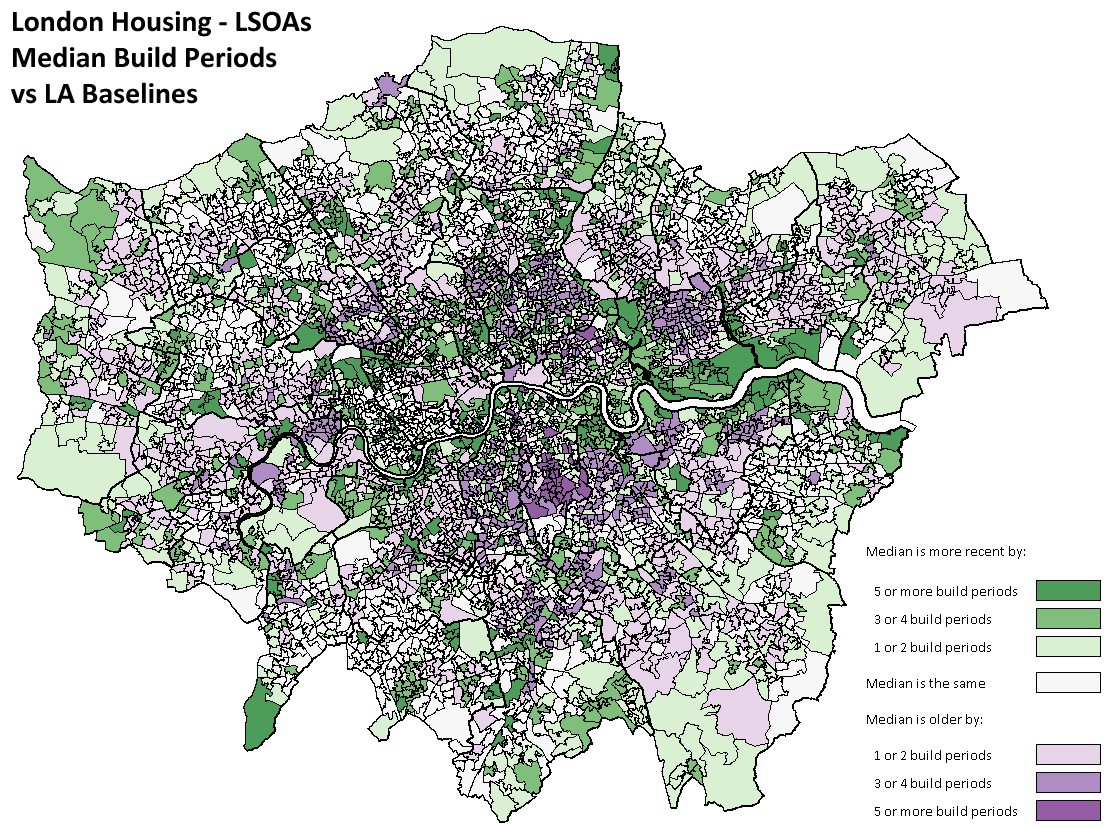
And these are the LSOA medians mapped against the various local authority medians. The median build period for London as a whole is 1930-1939 so there’s more green on this map.
Further research
All of this may seem kind of abstract but demonstrates that even quite unassuming public datasets like these VOA statistics have potential for analysis and re-use. Understanding the comparative age profiles of housing stock in small areas has a number of business applications in property investment and possibly insurance.
I think there’s more that can be done through statistical analysis of this data. It may be possible to generate a set of typologies that describe common shapes in the build period distributions, as an additional means of profiling and comparing the age of housing stock in different areas.
Attribution: I used a bunch of open data to produce the maps in this post, in addition to the VOA statistics, so: Contains Datadaptive data © Datadaptive copyright and database right 2016 Contains National Statistics data © Crown copyright and database right 2011 to 2016 Contains Ordnance Survey data © Crown copyright and database right 2011 and 2015 Contains public sector information licensed under the Open Government Licence v3.0.