Post: 18 January 2015
A week ago I wrote about Environment Agency’s Risk of Flooding from Rivers and Sea (RoFRS) dataset, which has recently been released as open data.
Since then Shoothill have launched a new website based on the RoFRS data: http://www.checkmyfloodrisk.co.uk/
Shoothill’s presentation of the data is in many respects similar to Environment Agency’s own public interactive mapping. However Shoothill have laid the RoFRS risk areas over Google aerial imagery and also provide calculated distances between postcode locations and the risk areas.
Predictably, some of the media coverage has encouraged readers to check whether their houses are at risk and talked up the “pinpoint accuracy” of the site’s functionality. However Shoothill themselves have been careful not to give the impression that the data is reliable at property level. If users try to zoom in too close the risk layer disappears.
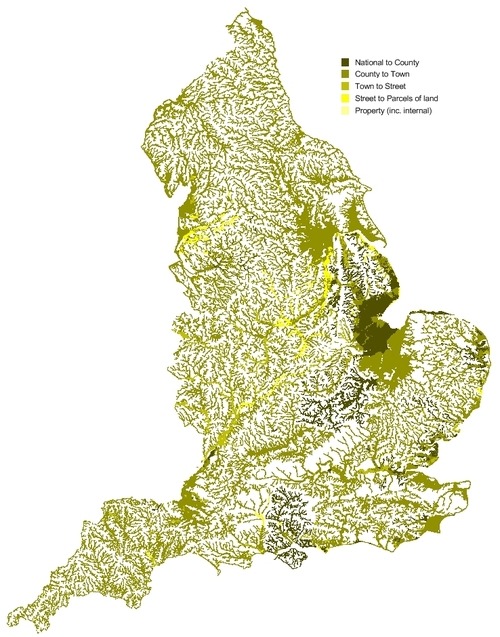
How reliable is the RoFRS data for identifying individual properties at risk? The spatial and property versions of the dataset actually include a “suitability” field that specifies, for each area of the floodplain, the spatial scale at which EA think the data is reliable:
(embiggen)
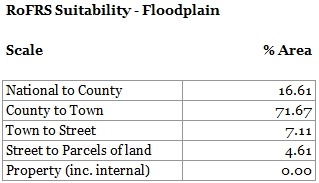
There are five scales of suitability. These are explained in detail in EA’s documentation, but following are the notes on reliability for individual properties:
By performing some calculations we can see that less than 5% of the floodplain (by area) has been modelled at a suitability scale likely to be reliable for identifying individual properties at risk:
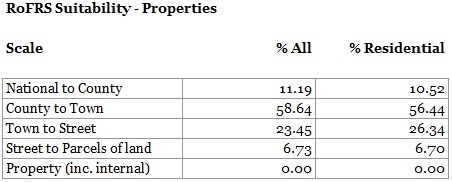
Of course some areas of the floodplain contain no properties. That figure improves to nearly 7% if we look at the suitability scales by number of properties within the floodplain:
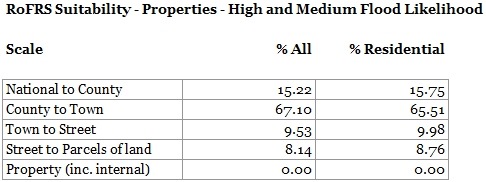
and to over 8% if we look only at properties in areas of High or Medium risk:
None of the above suggests any data quality issue. RoFRS isn’t designed to provide a reliable judgment on the flood risk to individual properties, and Environment Agency have always been clear about that.
Neither should reliability be confused with usefulness. There are numerous applications for the RoFRS dataset in which the “indicative” nature of the data is sufficient even when considering the flood risk to individual properties. (This is the basis on which the data has long been used within the insurance industry.)
However the above figures do underline the importance of making sure end users understand the limitations of the data. This is particularly the case when presenting the spatial version over maps or aerial imagery. End users can easily be misled by the hard edge of a polygon and miss the subjectivities in the underlying risk model.
The map image in this post is based on data from Environment Agency’s RoFRS spatial dataset, which is subject to the following attribution: “© Environment Agency copyright and/or database right 2014. All rights reserved © Crown copyright and database rights 2014 Ordnance Survey 100024198 Some features of this map are based on digital spatial data licensed from the Centre for Ecology & Hydrology, © NERC”.