I’ve made a basic tool to display and browse the Land Registry’s Price Paid information for February 2012 on a map, and put it on my website here:
http://www.owenboswarva.com/ppi/
As mentioned in previous posts, Land Registry maintains a dataset of more than 17 million residential property transfers in England and Wales going back to 1995. From last week Land Registry is releasing monthly updates to that dataset as ‘open data’ under the Open Government Licence.
The first open data available is a csv file containing 56,043 rows of data recorded in the month of February 2012. 93% of the rows of data are new transaction records, i.e. additions to the main Price Paid dataset. The remainder are either changes to existing records or records that Land Registry considers should be deleted from the main dataset.
However only 37% of the additional rows of data apply to property transactions that were effective in February 2012. The other 63% of rows covers property transactions from previous months – mainly January 2012 (44%) and December 2011 (13%).
This rather underlines the difficulty of treating the monthly updates as a discrete dataset. Due to the time lag in reporting of transactions it will be some months before we have a reasonably complete set of transaction data for February 2012.
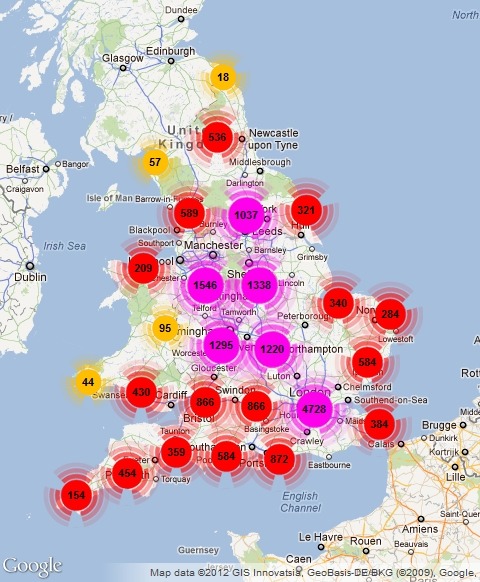
The map image above shows the geographic distribution of the 19,210 transaction records so far available for February 2012. I have geo-referenced these records to postcode level, relying mainly on the Ordnance Survey’s Code-Point Open dataset. The tool enables users to search transaction records from a map interface and look at the details of individual transactions.